Motion Given by a Motion Graph I
Task number: 1746
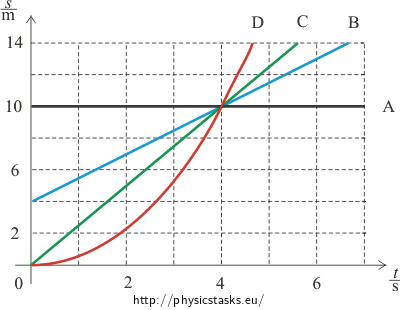
There are four position-time graphs of linear motions of toy cars A, B, C and D shown in the picture.
a) Describe verbally the motion of each car.
b) Determine the average speed of each car on the interval from 0 s to 4 s.
c) Determine the instantaneous speed of each car at t = 4 s.
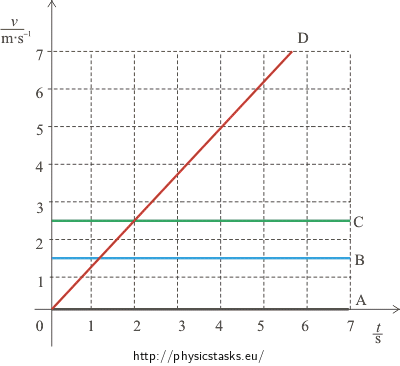
d) In one picture, chart the speed-time graphs for each car.
e) Determine the total displacement at t1 = 10 s of each car (including the initial non-zero displacement, if there is any), provided that the motion continues with the same time dependence as shown in the picture.

Hint 1 for a): Describing the motion
Graph A: Does the displacement change in time?
Graph B,C: What mathematical function can be used to describe the dependence of the motions on time? What can you say about the increments of displacement over equally long intervals of time? What about speed?
Graph D: What mathematical function can be used to describe the dependence of the motion on time? How does the speed of this motion change with time?
Hint 2 for b): Displacement, average speed
What is the displacement of the cars over the interval from 0 s to 4 s?
How do you calculate the average speed if you know the displacement and time?
Hint 3 for c): Instantaneous speed
Graph A, B, C: How does the speed of the motions change with time?
Where is the speed “hidden” in the graphs?
Graph D: How does the speed of a uniformly accelerated motion change with time?
Can you calculate the acceleration using values from the graph? How can you use it to determine the instantaneous speed?
Hint 4 for d): Graphs v = v (t)
Having the answers to the previous questions you now know how the speed of each motion changes with time and you know its value at any given time. Now you only need to plot the graph.
Hint 5 for e): Total displacement
Express mathematically the time dependence of displacement s(t) given by the graph. (You can find the answer for graph D in the solution to hint for c)).
Then find the value of the displacement for t = t1 = 10 s.
TOTAL SOLUTION
a) Graph A: The displacement of car A does not change in time. The car is at rest. The initial displacement is 10 m.
Graph B: The displacement increases linearly with time. The speed of the motion does not change. The car moves in a uniform linear motion with initial displacement of 4 m.
Graph C:The displacement increases linearly with time. The speed of the motion does not change. The car moves in a uniform linear motion with initial displacement equal to zero.
Graph D: The displacement can be mathematically expressed as a parabola – the displacement scales quadratically with time. It follows that speed scales linearly with time. The car moves in a uniformly accelerated linear motion with initial displacement equal to zero.
b) The average speed vp is determined by the ratio of displacement over the corresponding time interval of 4 s:
A: displacement \(s_4 =\, 0\), \(v_p=\,0\) ,
B: displacement \(s_4 =\, 6 \,\mathrm{m}\), \(v_p =\, \frac{6}{4}\,\mathrm{m \cdot s^{−1} }=\, 1.5\,\mathrm{m \cdot s^{−1} }\),
C: displacement \(s_4 =\, 10 \,\mathrm{m}\), \(v_p =\, \frac{10}{4}\,\mathrm{m \cdot s^{−1} }=\, 2.5\,\mathrm{m \cdot s^{−1} }\),
D: displacement \(s_4 =\, 10 \,\mathrm{m}\), \(v_p =\, \frac{10}{4}\,\mathrm{m \cdot s^{−1} }=\, 2.5\,\mathrm{m \cdot s^{−1} }\).
c) Graph A, B, C: The speed does not change with time. Instantaneous speed is therefore equal to the average speed calculated in b).
Speed is given by the slope of the lines.
Graph D:
The displacement of a uniformly accelerated linear motion is given by the formula:
\[s=\,\frac{at^{2} }{2}\,.\](The displacement and speed at time t = 0 s were equal to zero.)
Can be seen in the graph:
The displacement at time \(t = 4\,\mathrm{s}\) is \(s(4)=10\,\mathrm{m}\) .
We get:
\[10\,\mathrm{m}\,=\,\frac{a \cdot 4^{2}\,\mathrm{s^{2}}}{2}.\]Therefore:
\[a=1.25\,\mathrm{m \cdot s^{−2} }.\]And for the instantaneous speed:
\[v=at= (1.25 {\cdot} 4)\,\mathrm{m \cdot s^{−1}}=\, 5\,\mathrm{m \cdot s^{−1} }.\]d) Having the answers to the previous questions we now know how the speed of each motion changes with time and we know its value at any given time. Now we only need to plot the graph.
The speed-time graphs of the motion of each car:

The speed of cars A, B, C did not change with time:
Motion of car A: \(v_A =\, 0\).
Motion of car B: \(v_B =\, 1.5\,\mathrm{m \cdot s^{−1} }\).
Motion of car C: \(v_C =\, 2.5\,\mathrm{m \cdot s^{−1} }\).
Motion of car D:
From the speed-time graph it follows:
\[s=\,\frac{at^{2} }{2},\] \[10\,\mathrm{m} \,=\,\frac{a \cdot 4^{2}\,\mathrm{s^{2}}}{2},\] \[a=\,1.25\,\mathrm{m \cdot s^{−2} }.\]For the time dependence of speed it holds that:
\[v=at\,,\] \[v=1.25\,\mathrm{m \cdot s^{−2} }\cdot t\,.\]e) We can express mathematically the time dependence of speed s(t) given by the graph. (The answer for graph D can be found in the solution to hint for c)).
Then we find the value of the displacement for t = t1 = 10 s.
A: The car is still at rest:
\[s_0=s_1=\,10\,\mathrm{m}\,.\]B: The car moves in a uniform linear motion with a non-zero initial displacement:
\[s_1=s_0+v_Bt_1=\,(4+1.5{\cdot} 10)\,\mathrm{m}\,=19\,\mathrm{m}\,.\]C: The car moves in a uniform linear motion with its initial displacement equal to zero:
\[s_1=v_Ct_1=(2.5.10)\,\mathrm{m}=25\,\mathrm{m}\,.\]D: The car moves in a uniformly accelerated linear motion with its initial displacement equal to zero:
\[s_1=\frac{at_1^{2}}{2}=\frac{(1.25{\cdot} 100)\,\mathrm{m} }{2}=62.5\,\mathrm{m}\,.\]Answer
a) A: The car is at rest. B, C: The car moves in a uniform linear motion. D: The car moves in a uniformly accelerated motion. b) A: The average speed of the car over the interval from 0 s to 4 s is 0. B: The average speed of the car over the interval from 0 s to 4 s is 1.5 m·s−1. C: The average speed of the car over the interval from 0 s to 4 s is 2.5 m·s−1. D: The average speed of the car over the interval from 0 s to 4 s is 2.5 m·s−1. c) A: The instantaneous speed at time t = 4 s is 0. B: The instantaneous speed at time t = 4 s is 1.5 m·s−1. C: The instantaneous speed at time t = 4 s is 2.5 m·s−1. D: The instantaneous speed at time t = 4 s is 5 m·s−1. d)

e) A: Total displacement at time t = 10 s is 10 m . B: Total displacement at time t = 10 s is 19 m . C: Total displacement at time t = 10 s is 25 m . D: Total displacement at time t = 10 s is 62.5 m .


