Induced Voltage
Experiment number : 2099
Goal of experiment
The goal of the experiment is to show the dependence of the secondary voltage on the number of coil turns in a transformer. The experiment thus verifies the relationship for the transformation ratio of a transformer in an unconventional way and demonstrates the concept of “voltage per turn” at the same time.
Theory
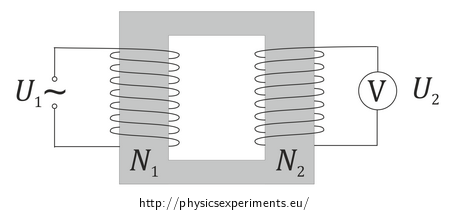
A transformer consists of a primary and a secondary winding which are mounted on a common core (see diagram in Figure 1).

If an alternating voltage is applied to the primary winding, a variable magnetic field is generated around it, which induces voltage in the secondary winding and (in the case of a closed circuit) current starts to flow. The magnitude of induced secondary voltage is given by the transformation ratio:
\[\frac{U_2}{U_1}=\frac{N_2}{N_1},\tag{1}\]where U is the voltage at primary (secondary) winding and N is the number of turns on primary (secondary) winding.
After adjusting the transformation ratio, we can see that the secondary voltage is directly proportional to the number of turns of the secondary winding:
\[U_2=\frac{U_1}{N_1}N_2.\tag{2}\]The constant of proportionality in this case is the ratio of the primary voltage and the primary number of turns.
The magnitude of the voltage induced in each turn is referred to as “voltage per turn”.
Tools
Procedure
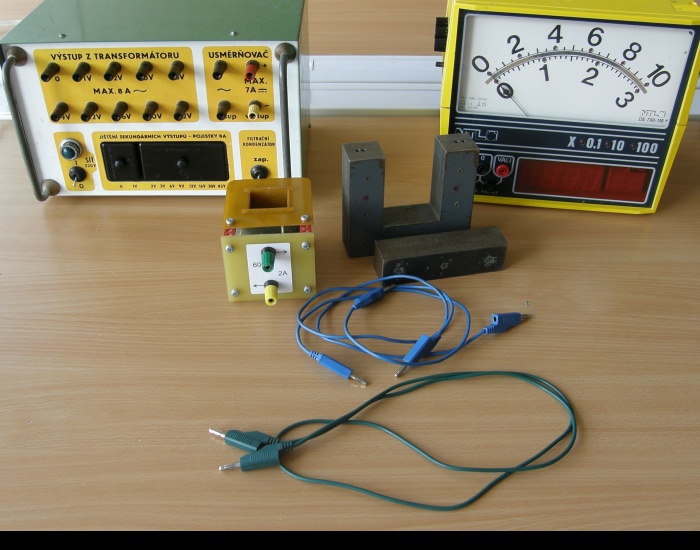
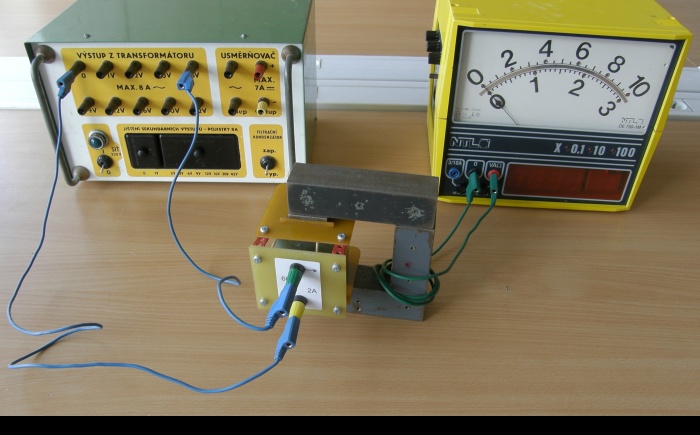
Connect the coils to form a transformer on a closed core. Use a coil with 600 or 300 turns as the primary coil, and as the secondary coil, wind one turn around the core. Connect the wire ends to the voltmeter. Connect the primary coil to an 6 V or 12 V AC power supply.
On the secondary side of the transformer, add turns and measure the induced voltage. Plot the measured values in a graph of secondary voltage vs. number of turns on the secondary winding.
Discuss the measured dependence and compare the observed voltage-per-turn value with the value calculated from the primary winding parameters.
Sample result
An example of measured values is given in the following table. This measurement was made for a primary coil with 600 turns and a primary voltage of 6 V.
N2 1 2 3 4 5 6 7 8 9 10 11 12 13 14 15 16 17 18 19 20 U2 (mV) 11.0 22.0 33.7 45.0 56.4 67.5 78.8 89.7 102 111 120 132 144 155 168 181 193 205 217 228
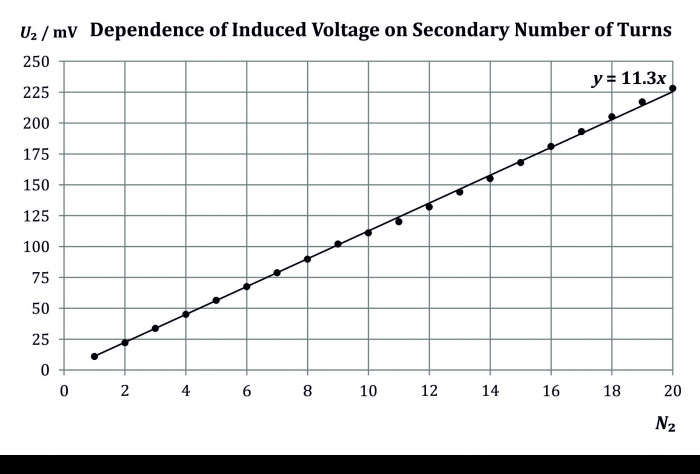
If we plot the measured values, we can see that induces secondary voltage is directly proportional to the number of turns on the secondary winding:
Since voltage in the graph is shown in millivolts, the shown slope of the line (and hence the voltage per turn) is 11.3 mV/turn, i.e. 0.0113 V/turn.
The ratio of primary voltage and primary number of turns is:
\[\frac{U_1}{N_1}=\frac{6\;\mathrm{V}}{600\;\mathrm{turns}}=0.01\;\mathrm{V/turn,}\tag{3}\]which agrees with the measured value of voltage per turn.
Note: The power supply used, when set to 6 V, gives the voltage of 6.9 V. Then the ratio of primary voltage and number of turns is 0.0115 V/turn, with a secondary ratio of 0.0113 V/turn, which corresponds to the measured value very closely.
Link to another experiment
Another unconventional view of the transformation ratio is offered in the task Transformer and the experiment Winding of a Coil.


