Experiment filter active?
Experiment rankings
Task tags
«
«
Dependence of Wire Resistance on Its Parameters
Experiment number : 1763
Goal of experiment
This experiment verifies the dependence of wire resistance on its parameters (length, cross section) and conductor material. This experiment also involves a problem task.
Theory
Resistance of a conductor depends on the length, cross section and material of the conductor:
R=ρlS,where ρ is the electrical resistivity of the conductor, l is its length and S its cross section.
Electrical resistivity (also known as just resistivity) of a conductor made from a particular material can be found in The Handbook of Chemistry and Physics. Among the best conductors belong e.g. silver, copper, gold, etc. Bad conductors are e.g. Kanthal, constantan, carbon and others. The unit of electrical resistivity is derived from the equation (1) above after determining ρ:
ρ=R⋅Sl,therefore
[ρ]=Ω⋅m2m=Ω⋅m.Wires made from a material with a large resistivity are called resistance wires. Their resistivity varies from about 0.42·10-6 Ω·m (nickeline) to e.g 1.4·10-6 Ω·m (Kanthal).
Note: Equation (1) applies accurately to the wire with cylindrical shape, in which the current flows in the direction of its axis, but this is usually met with a normal wire.
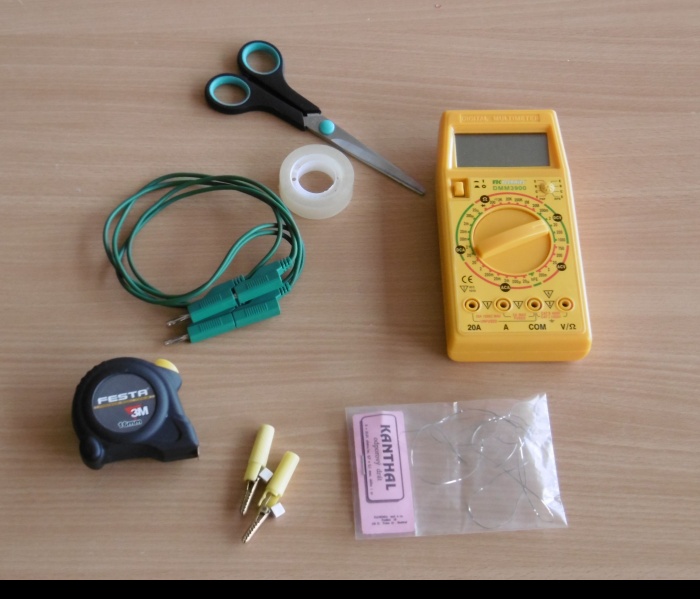
Tools
Procedure
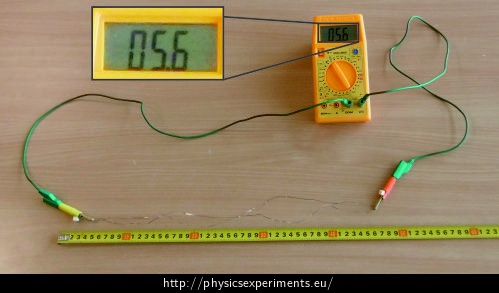
Use the ohmmeter to measure the resistance of the wire step by step by 10 cm. Make sure that the wire is properly attached to the ruler by crocodile clips.
Plot the measured values in a graph of resistance vs. length.
Measure the diameter of the wire and according to the relation (2) determine the electrical resistivity of the wire. Compare the resulting value with the value stated in The Handbook of Chemistry and Physics.
Sample result
This measurement was performed with a Kanthal wire 0.9 meter long with a diameter of 0.7×0.1 mm (the cross section is oblong, not circular). The measured values are listed in the table below.
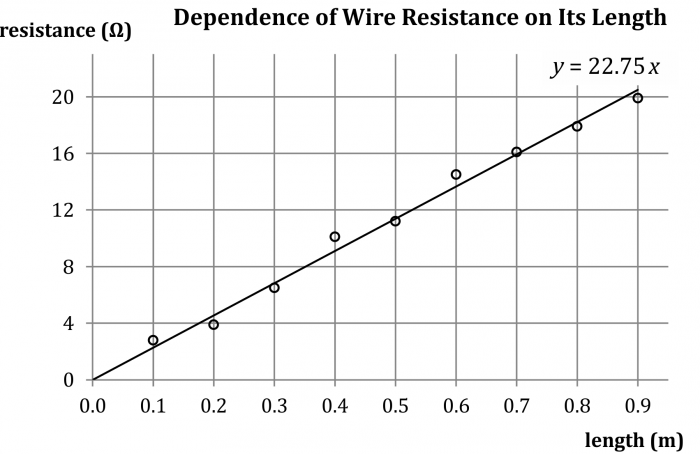
wire length (m) wire resistance (Ω) 0.1 2.8 0.2 3.9 0.3 6.5 0.4 10.1 0.5 11.2 0.6 14.5 0.7 16.1 0.8 17.9 0.9 19.9 If we plot the measured resistance values in a graph, the gradient of fitted line is the resistance of one meter of the wire.
The resistance of Kanthal wire one meter long is about 22.8 Ω.
If we substitute the measured values into the relationship for electrical resistivity of the wire (2) we obtain:
ρ=22.75⋅7⋅10−81=1.59⋅10−6Ω⋅mFor comparison, the table value of resistivity of Kanthal is 1.4 μΩ·m.
The difference between the measured and the table value is given mainly by the contact resistance between the clips and the wire.
Technical notes
When conducting this experiment, you need to take into account the transition resistance between the crocodile clips and the wire – pay attention to the correct fixation of the clips; if needed, you can clean the oxidized ends of the wire with a sand paper.
It is necessary to conduct this experiment with a resistance wire, since the electrical resistivity of a copper wire is too small.
Problem task – cutting wire in half
What is the resistance of the wire, if we cut it in half and measure the resistance of both halves as shown in Figure 3.

Link to a related problem
To solve a similar problem, see Electrical Resistances of Conductors of Different Lengths.


