Diagrams of Thermodynamic Cycles
Task number: 1287
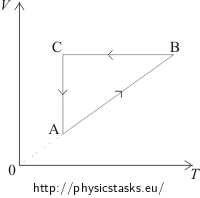
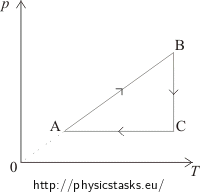
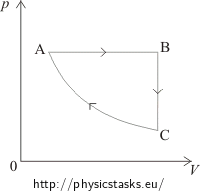
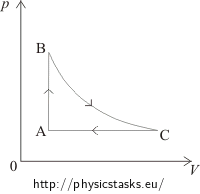
The ideal gas with a constant mass performs cyclic processes ABCA (as shown in the figures). Draw the pV diagrams of these processes.

|

|
| a) | b) |
Furthermore, determine in which phases the gas absorbs heat from the surroundings and when it gives the heat off. Determine when the work is done by the gas and when it is performed by the surroundings.
Hint – how to redraw the diagrams
For each part of the diagram first determine, which of the state functions describing the gas (p, V, T) are constant and which are proportional to one another. Then decide how to draw the pV diagram.
Hint – when the work is performed and the heat transferred
If the volume of gas
- increases, then the gas performs work (expands),
- is constant, then neither the gas nor the surroundings perform work,
- decreases, then the work is done by the surroundings (gas is compressed), i.e. we consider the work of the gas to be negative.
The internal energy of an ideal gas is proportional to the temperature, i.e. when the temperature changes, the internal energy also changes the same way.
The heat supplied or released can be determined by the law of conservation of energy, which in this case is usually called the First Law of Thermodynamics.
Solution – drawing the diagram a)
The VT diagram shows:

In the segment AB the volume of the gas is directly proportional to the temperature. This means that in this phase the pressure is constant, it is an isobaric process. In the pV diagram it is represented by a horizontal line. We can see that the volume in the first phase (from A to B) increases. Therefore, in the pV diagram state A has to be placed on the left side and state B on the right side.
In the segment BC the volume is constant; it is an isochoric process, in pV diagram represented by the vertical line. Since the temperature decreases between state B and state C, the pressure also decreases. Therefore, in the pV diagram state C has to be placed under state B.
The segment CA represents an isothermal process = the temperature remains constant. In the pV diagram shown by a part of a hyperbole.
Solution – energy balance of the graph a)
part of the cycle energy balance AB isobaric process - the volume increases => the gas performs work
- the temperature increases => the internal energy rises => we must supply heat
- the supplied heat = the increase of the internal energy + the work performed by the gas
BC isochoric process - the volume remains constant => the work is not performed by either the gas or the surroundings
- the pressure decreases => the temperature also decreases => the internal energy decreases => the heat is released
- the released heat = the decrease of the internal energy
CA isothermal process - the temperature remains constant => the internal energy does not change
- the volume of the gas decreases => the gas is compressed => the work is performed by the surroundings
- to keep the temperature constant during the compression, the gas must be cooled => the gas releases heat
- the work performed by the surroundings = the heat released by the gas
Solution – drawing the diagram b)
The pT diagram shows:

In the segment AB the pressure is directly proportional to the temperature, which means that the volume remains constant and the process is isochoric. This process is in the pV diagram represented by a vertical line. From state A to state B the pressure increases, therefore in the pV diagram, state A has to be placed under state B.
Between states B and C the temperature remains constant. The process is isothermal. This process is in the pV diagram represented by a hyperbole in such a way, so that the volume increases.
The segment CA shows a constant pressure = an isobaric process, in the pV diagram represented by a horizontal line from the right to the left, because the volume decreases.
Solution – energy balance of the graph b)
part of the cycle energy balance AB isochoric process - the volume remains constant => the work is not performed by either the gas or the surroundings
- the pressure increases => the temperature increases => the internal energy increases => we must supply heat
- the supplied heat = the increase of the internal energy
BC isothermal process - the temperature remains constant => the internal energy does not change
- the volume of the gas increases => the gas expands => the gas performs work
- to keep the temperature constant during the expansion, the gas has to be heated => the heat needs to be supplied to the gas
- the work performed by the gas = the heat supplied to the gas
CA isobaric process - the volume of the gas decreases => the work is performed by the surroundings (the gas is compressed)
- the temperature decreases => the internal energy decreases => the heat is released
- the released heat = the decrease of the internal energy + the work performed by the surroundings


