A lift
Task number: 651
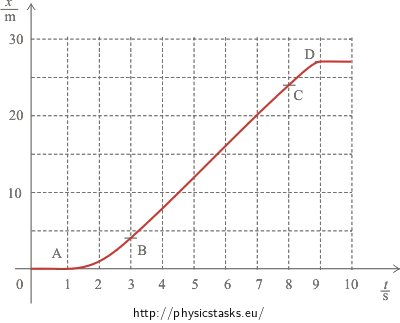
Time variation of position x(t) of a lift cage is shown in the picture.
a) Describe verbally the motion of the cage.
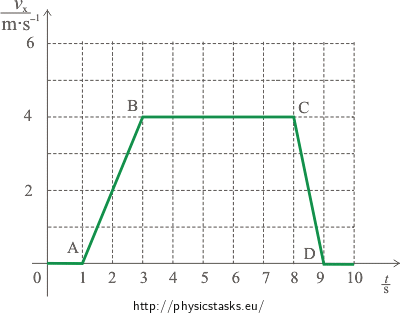
b) Draw the time variation of the speed of the lift cage.
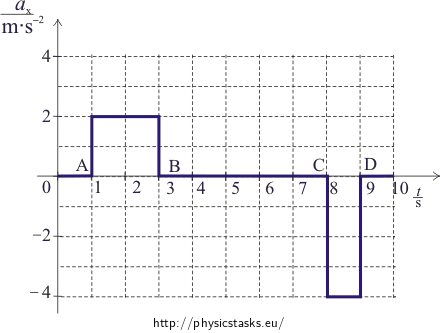
c) Draw the time variation of the acceleration of the lift cage.
d) A spring with a ball hangs from the ceiling of the cage. Describe the behaviour of the spring during the motion of the lift.

Point A: position x = 0 m in the time t = 1 s
Point B: position x = 4 m in the time t = 3 s
Point C: position x = 24 m in the time t = 8 s
Point D: position x = 27 m in the time t = 9 s
Hint 1 for a): Description of the motion
Divide the motion of the lift cage into separate sections between the origin of coordinates and point A, between point A and point B, between point B and point C, between point C and point D, and between point D and the end. You can determine what kind of motion the cage performs in each of the separate sections based on the shape of the curves corresponding to the time variation of position x(t) of the lift cage.
Hint 2 for b) Coordinates of the speed
You know from the previous hint what kind of motion is there in each part, so you can decide if the magnitude of the speed changes or not and how.
Determination of the magnitude of the speed is easy for the motion of the cage before point A and after point D.
Between points A and B and between points C and D the lift moves with a constant acceleration. You know what the initial and the final magnitude of the speed is in both parts. You can draw a shape of the curve into a graph easily.
You know that the motion maintains constant speed between points B and C. You can determine the magnitude of the speed of the lift cage from the graph in the assignment.
Note
Consider if it were possible to determine reversely the course of the position x(t) from the graph vx(t).
A solution to this problem isn’t clear-cut. The graph of the functional vx(t) gives only some information on the changes of the position (not on the position itself). We can determine changes of the position from the graph in an arbitrary time interval
\[\int_{t_1}^{t_2}{v_x(t)}\]which corresponds to the area of the surface under the curve in the graph restricted by the start up and the end point of the time interval. To determine the position at the beginning and at the end of this interval we need a next piece of information for example the position in time t = 0 s .
Hint 3 for c): Coordinates of the acceleration
You already know how the coordinates of the speed of the lift change with the time.
Realise what the acceleration will be like in the sections where the speed doesn’t change.
In sections AD, as the case may be CD, the speed grows linearly, as the case may be declines linearly. Determine the magnitude of the acceleration from the graph vx(t). Realise what direction the acceleration will have in these sections.
Hint 4 for d): A spring with a ball
Realise which forces affect the ball (from the perspective of an observer who stays on the ground floor) and what holds for their resultant in the particular sections. The relation of the resultant of the forces to the acceleration is stated by Newton’s second law.
COMPLETE SOLUTION
a)
Between the origin of the coordinates and point A the position of the lift cage doesn’t change (and equals zero). The cage is thus at rest, it stands in the lower floor.
Between points A and B the time variation of the position has a shape of a parabola, the coordinate grows quadratically. The lift moves upwards by the motion with a constant acceleration.
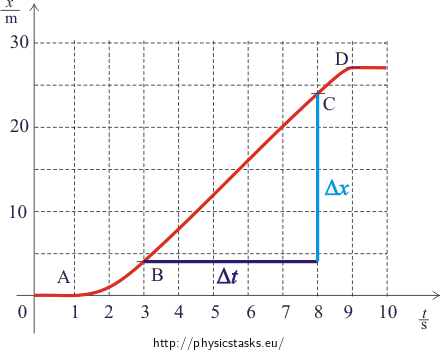
Between points B and C the graph of the time variation of the position is a line. The lift moves with a constant speed, which it reached in point B.
Between points C and D the graph of the time variation of the position is again a part of a parabola. The coordinate still grows but at a lower and lower rate. It is a motion with a constant negative acceleration; the cage slows down to a halt.
Between point D and the end the position of the lift cage doesn’t change. The cage is at rest.
b)
The function vx(t) is a derivative of the function x(t):
\[v_x(t)=\frac{dx}{dt}\]Sections of the graph before point A and after point D correspond to the situation when the lift cage is at rest. A graph of the function x(t) in these sections are lines parallel to the time axis. The angular coefficient of the tangent (and also the speed of the cage) equals zero.
Between points B and C the cage moves with a constant speed, which we determine as the angular coefficient of the line BC:
\[v_x=\frac{\Delta{x}}{\Delta{t}}=\frac{(24-4)\,\mathrm{m}}{(8-3)\,\mathrm{s}}=4\,\mathrm{m.s^{-1}}\]
Point A: position x = 0 m in the time t = 1 s
Point B: position x = 4 m in the time t = 3 s
Point C: position x = 24 m in the time t = 8 s
Point D: position x = 27 m in the time t = 9 s
The speed of the cage changes at the beginning of the motion (part AB) and during the repeated stop (part CD), i.e. in the time intervals from 1 s to 3 s and from 8 s to 9 s. If we suppose that the lift starts and stops uniformly, the time variation of the speed will be linear (lines AB and CD).
The time variation of the speed of the cage is depicted in the following graph:

c)
You know that the function ax(t) is a derivative of the function vx(t):
\[a_x(t)=\frac{dv_x}{dt}\]Sections of the graph before point A and after point D correspond to the situation where the lift cage is at rest and thus the acceleration equals zero.
The acceleration equals zero again between point B and point C because the cage moves with the constant speed.
The speed grows up linearly between point A and point B, the acceleration is constant with the positive value and we determine the magnitude of the acceleration from graph vx(t) as a direction of line AB:
\[a_{AB}=\frac{\Delta{v_{AB}}}{\Delta{t_{AB}}}=\frac{(4-0)\,\mathrm{m}}{(3-1)\,\mathrm{s^2}}= 2\,\mathrm{m.s^{-2}}\]The speed falls down linearly between point C and point D, the acceleration is constant with the negative value and we determine the magnitude of the acceleration from graph vx(t) as a direction of line CD:
\[a_{CD}=\frac{\Delta{v_{CD}}}{\Delta{t_{CD}}}=\frac{(0-4)\,\mathrm{m}}{(9-8)\,\mathrm{s^2}}= -4\,\mathrm{m.s^{-2}}\]The time variation of the acceleration of the cage is depicted in the following graph:

d)
The ball is affected by the gravitational force of the Earth and by the force of the spring on which the ball is hung.
Both these forces are in balance and their resultant of forces equals zero in the parts before point A, between point B and point C and after the point D, where the acceleration of cage equals zero.
However in part AB the spring must pull a bit more to give the ball acceleration upwards – the spring stretches.
On the contrary in part CD, in which the lift slows down, the acceleration heads downwards against the direction of the motion. The spring must pull a bit less than when the cage is at rest (or when it moves with constant speed) so that the resultant of forces would head downwards – the spring shrinks.
Answer
a) At first the cage stands downstairs and thus it is at rest – in the graph it is the line between the origin of coordinates and point A. Then the lift goes up (the positive direction of coordinate axis), moves with the constant acceleration up to the definite speed – in the graph it is the line between point A and point B. The cage travels at this constant speed during the definite time (the rectilinear motion with constant speed) - in the graph it is the line between point B and point C. In the end the cage starts slowing down - in the graph it is the line between point C and point D. The curve from point D means that the cage is at rest again.
b) The time variation of the speed of the cage is depicted in the following graph:

c) The time variation of the acceleration of the cage is depicted in the following graph:

d) In these cases, where the cage is at rest (sections before point A and after point D) or when it travels at constant speed (section between point B and point C), the length of the spring does not change and stays the same. When the cage starts moving (the section between point A and point B), unlike in the case when the cage is at rest, the spring starts stretching. On the contrary when the cage starts slowing down (the section between point C and point D) the spring shrinks in comparison to the length when the cage is at rest.


